What are we building?
on
Read the docs
Download White Paper
Approach
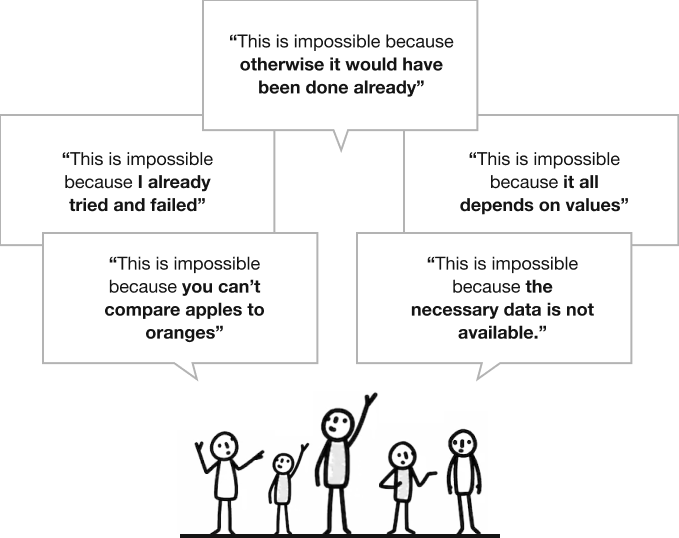
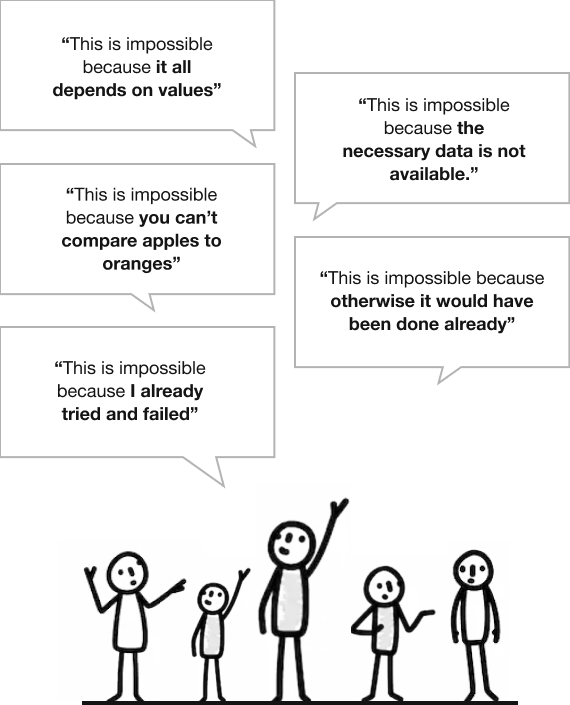
We are building something many think is impossible. It's OK.
Our approach for building the net impact model is:
Iterative
The model will never be ready. Rather we build a new version practically every week. New products, research and companies emerge every day, and that is pretty cool. We are happy that already now, in our project’s infant phase, we are able to produce information and understanding that to our knowledge no other system can. However, the road ahead of us keeps us humble and excited.
Fiercely practical
The model will never be perfect. All models and numerical representations are just proxies, they ARE not the truth. A perfect model accurately depicting all impacts of all companies in real-time is theoretically impossible. However, a net value creation measuring system significantly better than the one at use today CAN be done.
Collaborative
We want to put together all the work of millions of researchers by using scientific articles as our main input data. Also, we want to build a system where everyone who wants to contribute to the building of better understanding of what companies achieve can do so. Our aim is to help people collaborate in making more fact-based decisions.
"Big stuff only"
This is our dearest design principle throughout the model. It means we only concentrate on the largest impacts a company has on the surrounding world. It’s the only way to stop losing sight of the Tier 1 priorities in Tier 2-10 data. Also, it’s a great way to stay sane. Practical example: for an oil company, we don’t care whether or not they use recycled office paper.
uses
What is the Upright net impact model built for and good at?
The model is built for...
Understanding what resources are used for
Understanding the scale of impacts
Getting comparable data on large groups of companies
Comparing across industries and different types and sizes of companies
Tracking progress in time
Stress-testing against multiple sets of values
The model is not built for...
Measuring sustainability projects and charity efforts
Dividing companies into good and bad ones
Getting in-depth analyses for individual companies
requirements
The Upright net impact model is a mathematical model of the economy that produces continuously updated estimates of the net impact of companies by means of an information integration algorithm that consolidates data from humanity’s accumulated scientific knowledge and public statistical databases.
The Upright net impact model is designed to satisfy the following requirements:
Measure net
The model must consider both costs and gains, and provide their net sum. This is a minimum requirement for informing decision-making on resource allocation.
Comprehensiveness
The model must consider all types of costs and gains, not only, e.g., environmental costs or financial gains. This is a minimum requirement for understanding the whole value creation of a company and thus informing decision-making on resource allocation.
Whole value chain
The model must capture the cost and benefits created in the whole value chain of a company, not just what happens inside the company or how it affects its immediate stakeholders (shareholders, clients, employees).
Comparability
All estimated costs and benefits produced by the model must be comparable. Comparisons must be possible within industries, across industries, and across different types of costs and benefits.
Scalability
The marginal cost of estimating the impact of an additional company should be close to zero, meaning that it should not require any manual work. This is required for large-scale adoption and thus significance of the data.
Adaptable values
The model must not assume universal values, and must instead accommodate for the fact that every individual decision-maker has a different view of value and different optimization criteria when making decisions in different roles.

Output
What do the results look like and how do I read them?
The idea of the net impact graph is to bring out the shape of a company: what “resources” it uses or “costs” it creates - and what it gets done, or what are the “gains”. The net sum of these two groups of various negative and positive impacts forms the overall picture of value creation by the company. Simple! Well, at least in theory.
+
1. Negative & positive impacts
+
2. Nineteen impact categories in four dimensions
+
3. Three parts of the value chain
+
4. Impact scores
Model
Explore real data in the net impact model
This page was only an introduction to the Upright net impact model. Now that you have an overview of what’s up, click yourself into the deep end by accessing the full model.
Sign up or log in
Our mission
Wondering why this is relevant?
We believe investors, companies, consumers and employees need more fact-based information and big picture understanding of how their choices impact the world around us.
Learn more