Report PAI and EU Taxonomy across 100% of your portfolio
Trusted by 300+ leading organisations


SFDR asks for 100% coverage. Portcos provide a fraction of it.
SFDR and EU Taxonomy require sustainability metrics across your entire portfolio. Most companies – especially in private markets – don’t disclose them.
SFDR 2.0 formally allows estimates. The question isn’t whether to use proxy data, but how good your proxies are. Sector averages built on ∼1,000 NACE codes can’t distinguish a medical device manufacturer from a tobacco company.
Upright's data engine builds estimates from a granular product and service level taxonomy – not industry averages, not company self-disclosure.
data offering
The most granular modelled regulatory data in the market
Data metrics
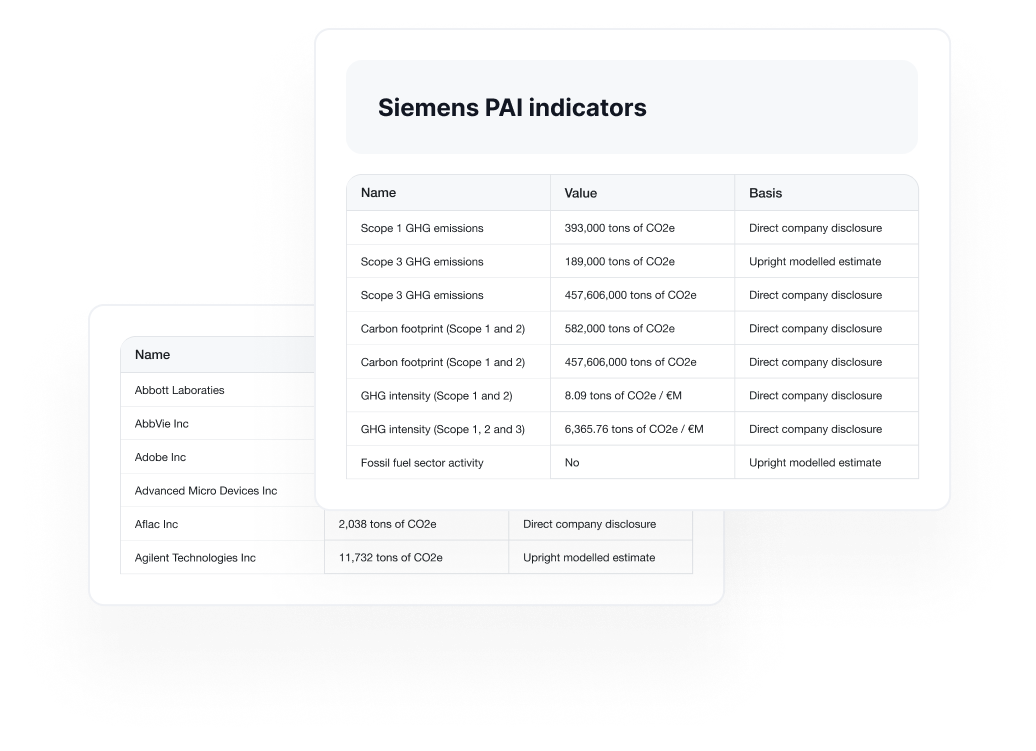
- SFDR PAI indicators: Coverage all 18 mandatory indicators plus several optional ones, with modelled product-level estimates provided when direct company disclosure isn't available.
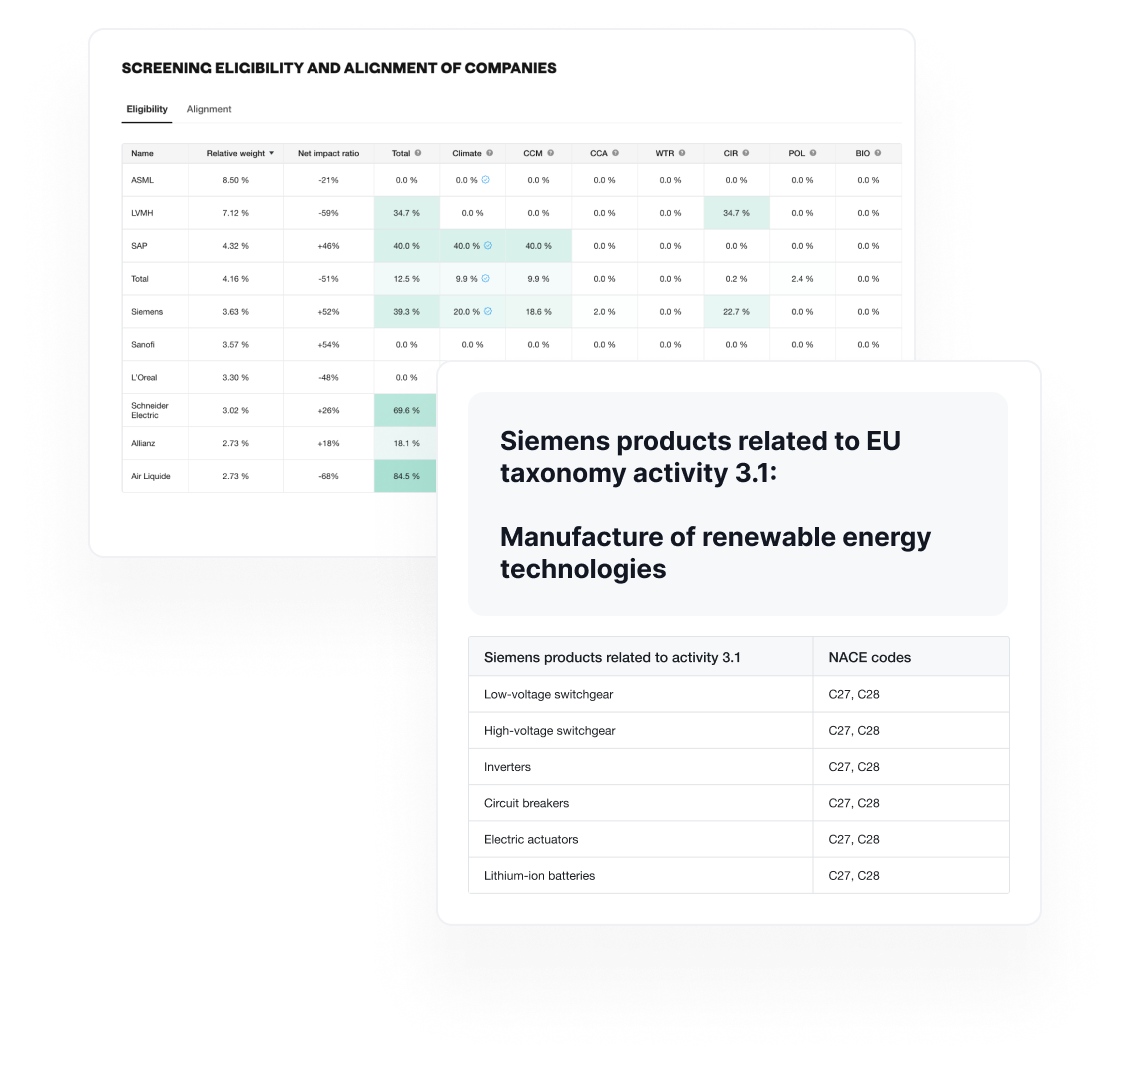
- EU taxonomy alignment: Metrics broken down by all six environmental objectives, with both eligibility and alignment estimates at company and portfolio level.
Coverage
- 100% on-demand private markets coverage, with a benchmarking database of 70,000+ companies across 190 countries and 150 major indices
- Off-the-shelf coverage of 70,000+ companies and 40,000+ funds
HOW?
How Upright produces product-level estimatesNot sector-level guesses
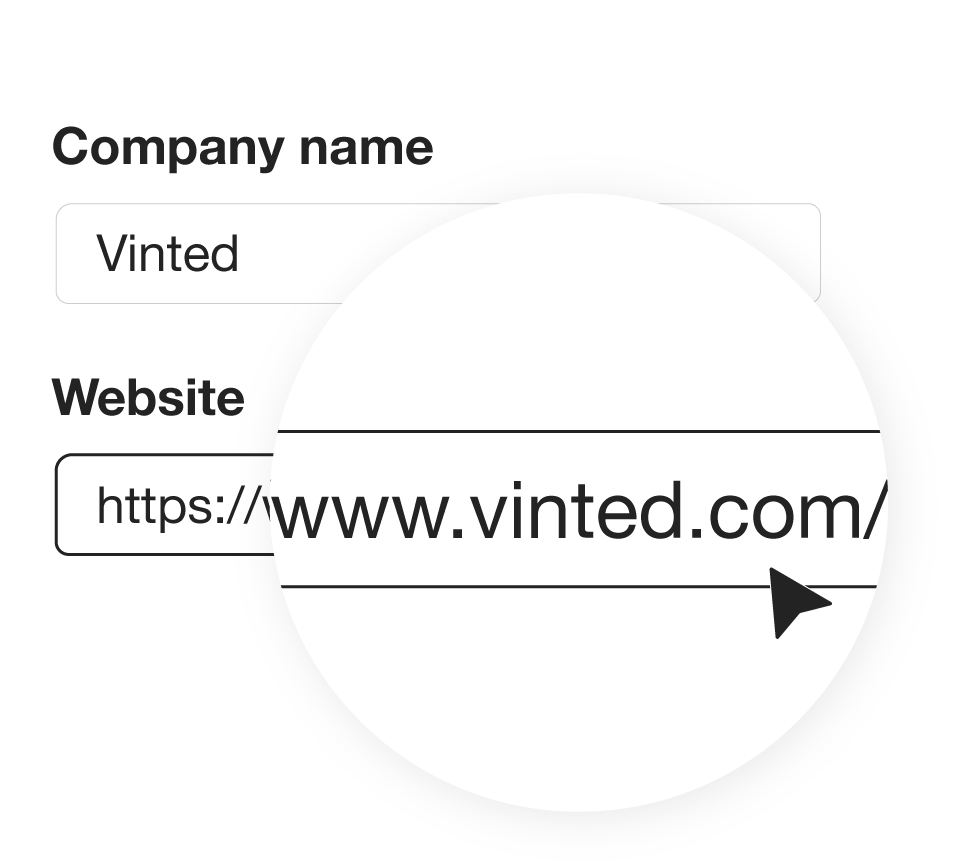
1. Identify the company’s products and services
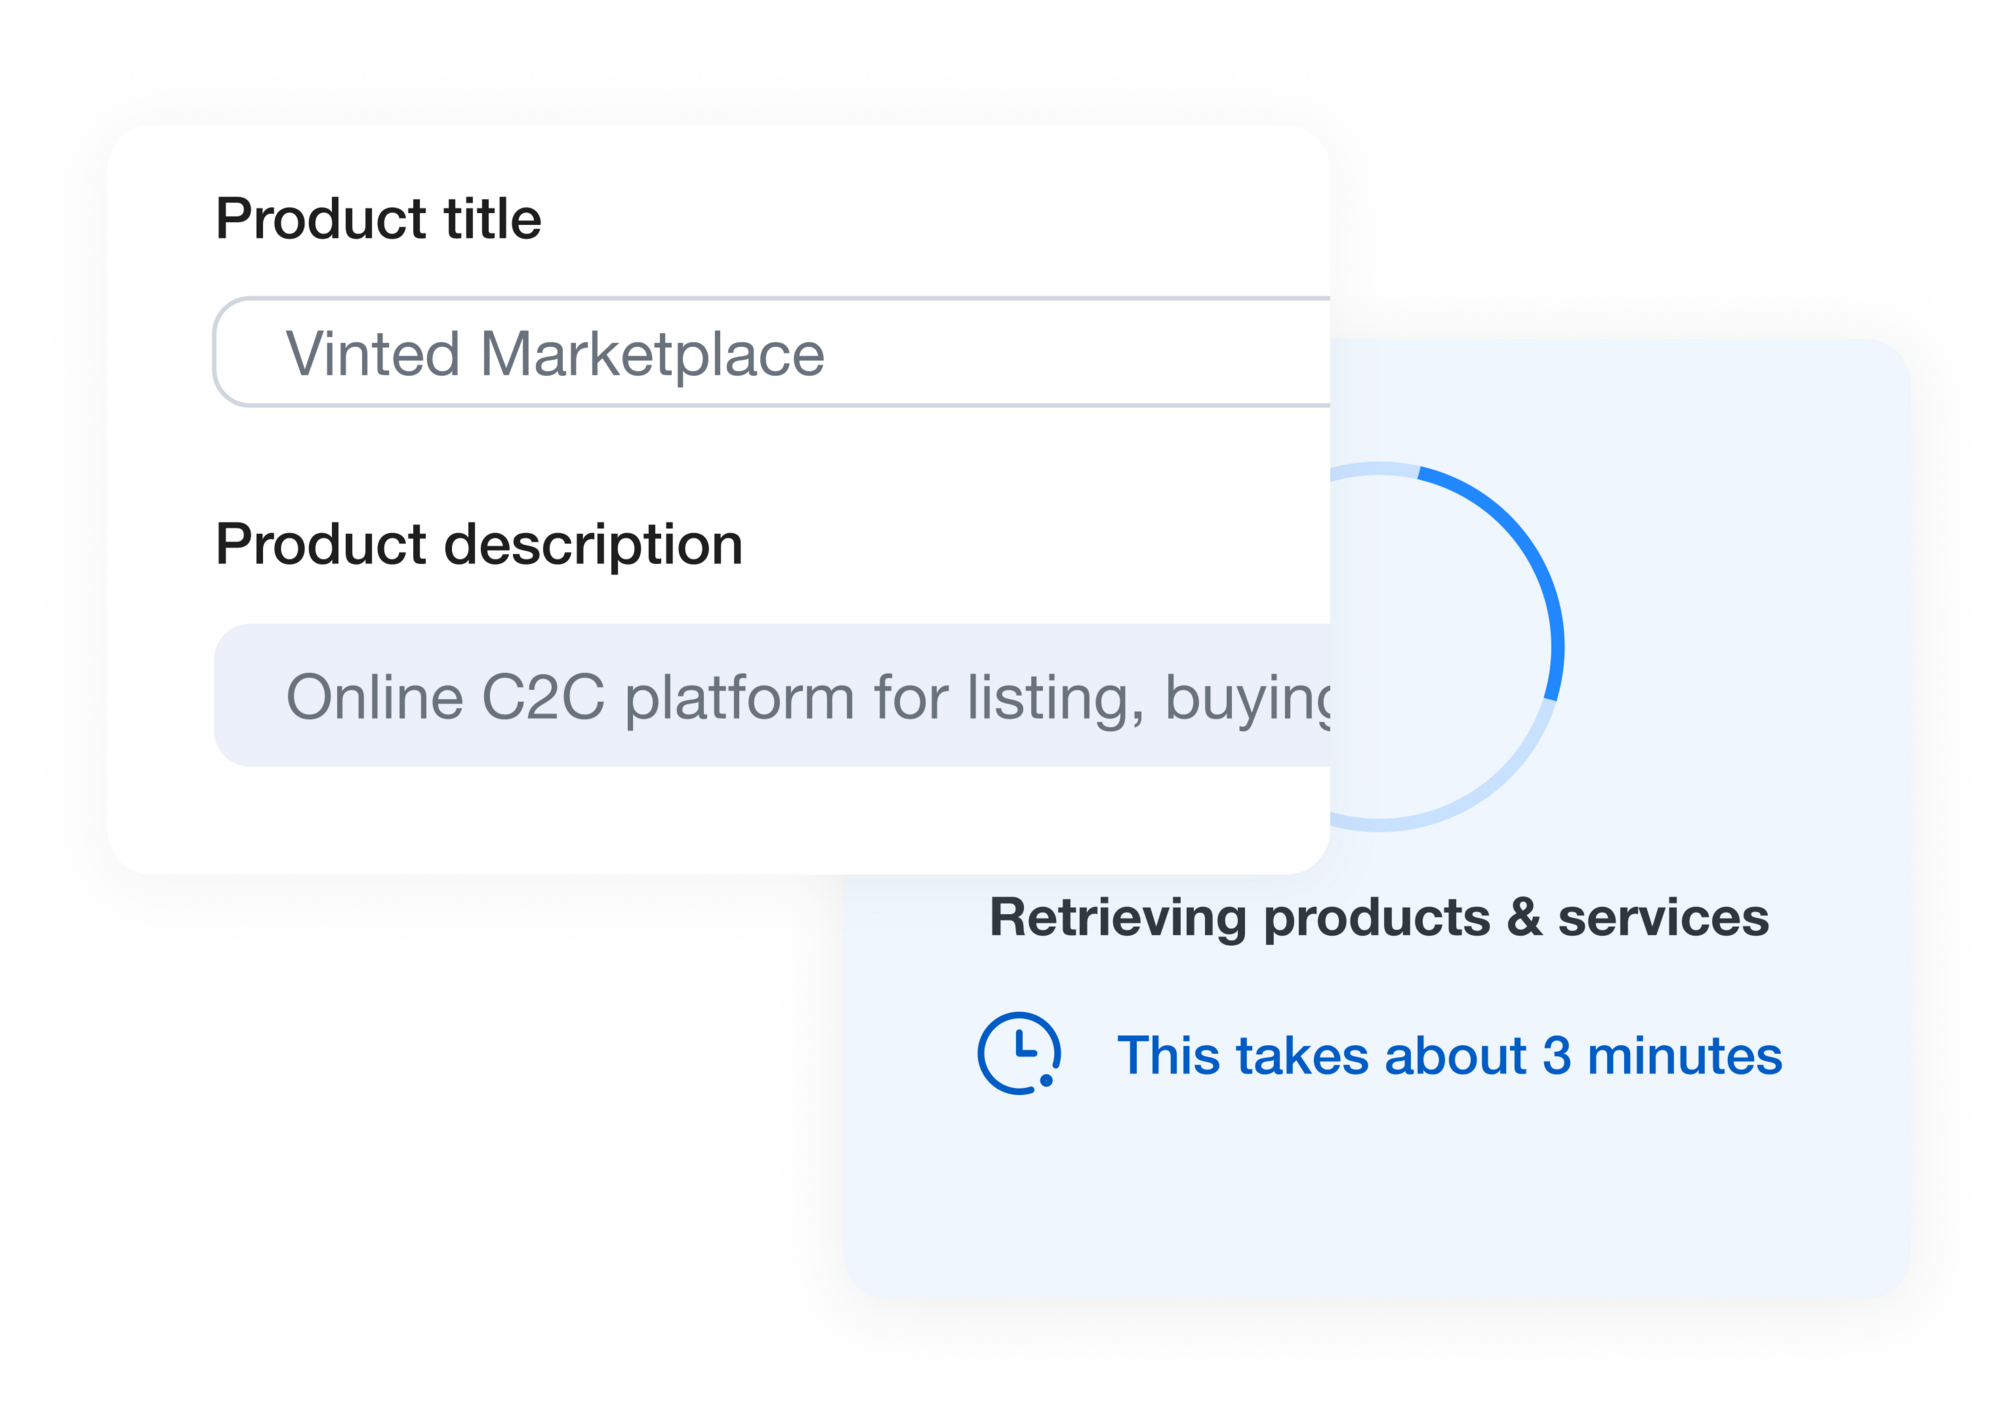
All Upright needs is a company name and website. The platform maps the company to specific products and services from a taxonomy of 150,000+ categories – not a single sector label.
2. Model regulatory metrics from the product level up
Using the product mix, Upright estimates PAI indicators and EU taxonomy metrics based on what the company produces – not what its sector produces on average. All metrics derived from the same product-level foundation.
3. Calibrate with revenue and disclosed data
Revenue figures scale estimates to company size. Where disclosures exist, they’re incorporated alongside modelled estimates. The result is a company-specific data point – not an industry average wearing a company name.
4. Deliver at company and fund level
All estimates available at entity level and aggregated to fund level. Access via platform, API, SFTP, or Excel – ready for regulatory filings, LP reports, or internal dashboards.
Why Upright
Seeking further solutions?
Impact Quantification
Quantify real-world impact outcomes and revenue alignment for companies and funds. Science-based, product-level quantification across four impact dimensions.

LP & Regulatory Reporting
Report fund impact to LPs and classify sustainable funds under SFDR. From PAI filings to public impact reports – structured outputs built on the same data.